Still early, but the shape is showing
Bitcoin squeezed toward $87.4k, rebuilt confidence, then produced the first meaningful deleveraging wave. September is too early to call a tail.
Get the next letter by email →

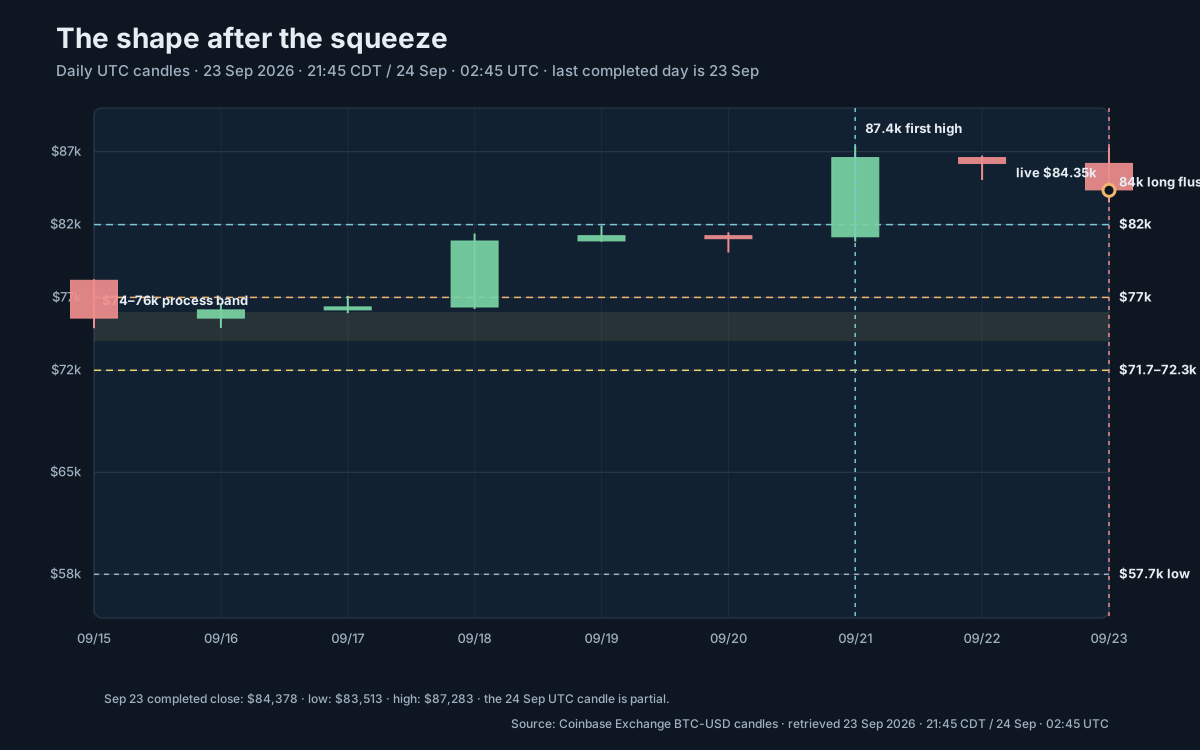
As of 23 September 2026, 9:45 p.m. Central / 24 September 2026, 02:45 UTC, Coinbase BTC-USD was about $84,354. The last completed UTC daily candle, 23 September, closed at $84,378 after trading from $83,513 to $87,283. The new 24 September UTC candle was only a few hours old, so it is not used as a completed-day fact. Coinbase ticker · Coinbase daily candles
1. Central answer
Observed: Bitcoin squeezed from the mid-$70,000s to a $87,397 high, then produced its first meaningful long-liquidation wave on the way back below $84,000. Calculated: the last completed day was a 4.32% high-to-low reversal, but the 17 September close to 23 September close was still up about 10.5%. Inferred: the market has demonstrated the mechanism of a fast deleveraging event, not the destination of a final bear-market tail.
The cleanest answer is therefore: still early, but the shape is showing. The approximately $57.7k low may have been the completed bear-market bottom. It may also have been first capitulation before a slower failure. The evidence does not decide that today. The desk decision is WAIT: preserve cash and optionality while the market tests $82–83k, $80k, and $77k in order.
2. What actually happened
Bitcoin did not travel in a straight line from $58k to a new bull-market high. It moved through a sequence. The 18 September candle first traded above $81k. The 21 September candle reached $87,397 and closed at $86,595. The 22 September candle reached $86,734 and closed at $86,198. On 23 September, a second attempt above $87k failed: the high was $87,283, the low was $83,513, and the close was $84,378. A second test produced rejection, not confirmation.
The technical backdrop is mixed rather than broken. Using completed Coinbase closes through 23 September, calculated SMA20/SMA50/SMA200 were approximately $79,508 / $74,529 / $70,759. RSI14 was 65.4 and MACD remained positive, with a +$569 histogram. The trend is still above its major averages; momentum has simply rolled over from the squeeze. Observed and calculated, not a forecast.
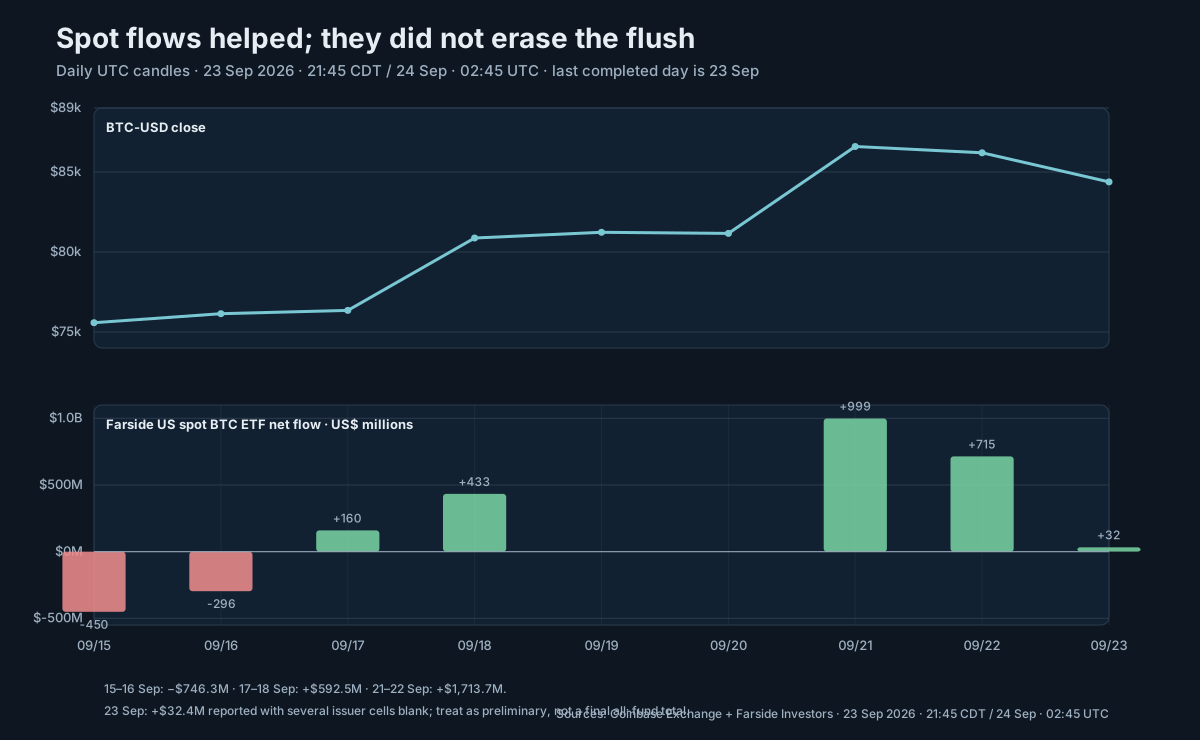
ETF demand helped the rally. Farside reported −$450.4M and −$295.9M on 15–16 September, then +$159.5M, +$433.0M, +$999.0M, +$714.7M, and a preliminary +$32.4M across the reported sessions from 17–23 September. That is a real improvement in the vehicle-level tape. It is not proof that the demand is permanent, all-spot, or immune to a redemptive day. Farside Bitcoin ETF flow table
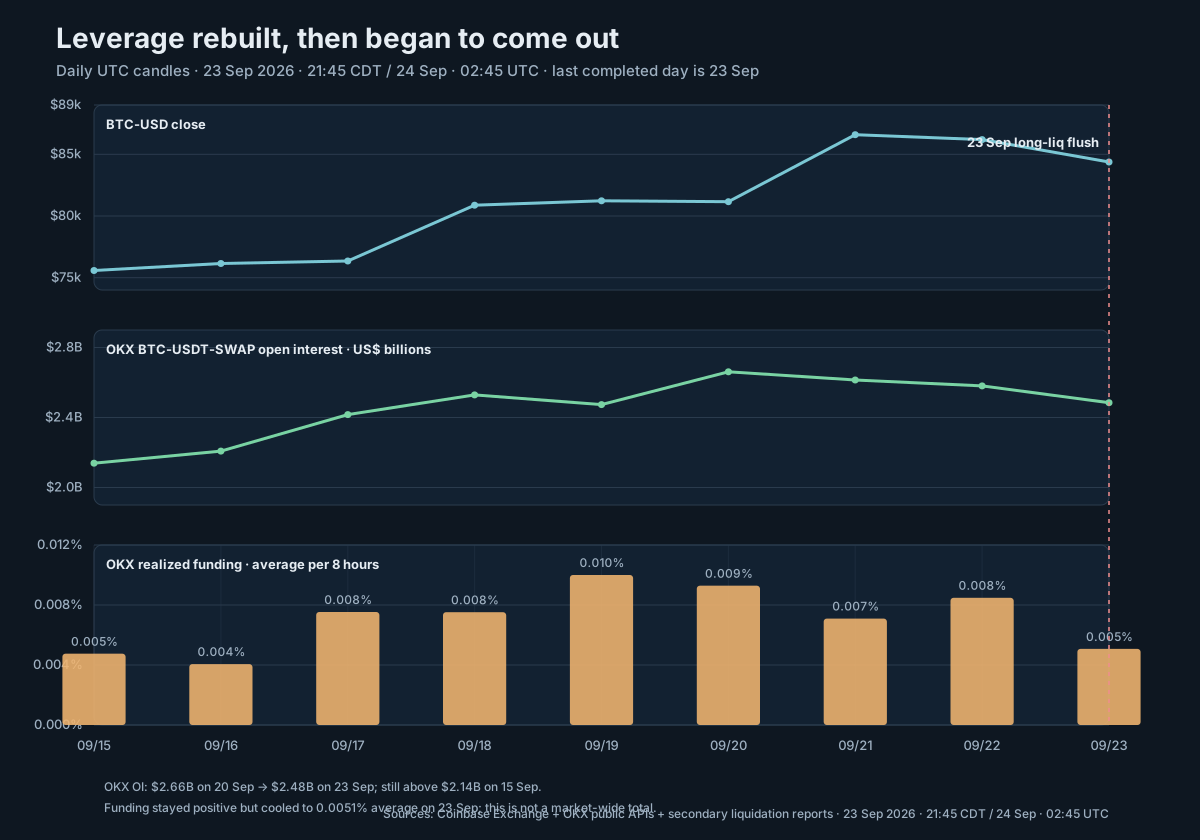
Derivatives supplied torque and then began to release it. OKX BTC-USDT perpetual open interest rose from about $2.14B on 15 September to $2.66B on 20 September, then fell to $2.48B on 23 September. Average realized funding stayed positive but cooled to about 0.0051% per eight hours on 23 September. Secondary reports citing CoinGlass differed by window, but both described more than $200M of long liquidations as BTC moved below $84k. The shared signal is stronger than the exact total: leverage accelerated the rally and then accelerated the reversal. OKX OI · OKX funding · liquidation report
3. What the 23-agent council saw
The blind first round did not receive the Controller's crash sequence. The 23 project-scoped lenses read the same timestamped packet and clustered around a careful middle: price structure has improved, ETF demand is supportive, and the long flush is real; the bottom question remains open because on-chain, cross-venue, and depth evidence is missing.
Market structure: bang_technician, killa_quant, options_vol, capriole_systematic, and risk_red_team all treated the $83.5k sweep as a warning against chasing. They disagreed on how much weight to give the positive averages and whether the OI decline is a healthy reset or the first leg of forced deleveraging.
Macro and money: macro_liquidity, carter_monetary, hayes_crypto_credit, cowen_cycle_risk, and sector saw higher yields, a DXY near 101, a hot 58.4 US flash PMI, and still-expanding money/stablecoin supply. Their disagreement was about timing: macro pressure can coexist with a risk rally, and broad money does not prevent a collateral event.
Institutional and flow lenses: bitwise_fundamentals, glassnode_onchain, cryptoquant_flows, filings, and insider agreed that ETF flows are the strongest new evidence, while refusing to call them durable spot absorption without holder, CVD, miner, and creation-quality data.
Specialist no-story calls: leopold_ai_scaling, eth_platform, hasu_incentives, murad_meme, policy_regulation, earnings, and chatter found no verified special catalyst in their lanes. Their refusal to invent an AI, ETH, meme, policy, or earnings explanation is itself part of the evidence packet.
Process: chief_of_staff kept the rule stable: update the levels, do not rewrite the old ledger, and do not move mid-November merely because the date is available.
4. Where the agents disagreed
Three disputes survived cross-examination.
- Cash demand versus leverage: ETF creations support the bull case; rising OI and the long-liquidation wave say part of the move was mechanically financed. The council landed on both, not one.
- Bottom versus first capitulation: the $57.7k low is a credible local-bottom hypothesis, not a proven cycle bottom. A few four-year rhymes are too small a sample to overrule the tape.
- M2 and machine speed: money growth may make a prolonged liquidity desert less likely, while automation may increase both displacement speed and recovery speed. Neither is a reliable near-term timing tool.
The second round became slightly more defensive: the strongest bear revision was not “the tail is here.” It was “the tail mechanism is now observable, so do not mistake a positive ETF tape for immunity.” The full 23-lens Round 1/2 record is frozen in the research packet that ships with this issue.
5. The shape
The shape is a sequence, not a date. Hypothesis: 2025 top → 2026 bear → approximately $57.7k reset → strong recovery → confidence → approximately $87.4k → leverage rebuild → first deleveraging → unknown. This is a useful question because it tells us what to observe next. It is not useful as a promise that November must deliver a final panic.
The competing hypothesis is simpler: the $57.7k area was already the bear-market low, the September rally is normal price discovery, and this pullback is a reset before another expansion. That case is alive. The market has not earned the right to dismiss it.
6. Why today was not the tail
A tail is not defined by a large red candle alone. The 23 September move was fast and leveraged, but the packet still shows price above SMA20/SMA50/SMA200, a close above $84k, positive though cooling funding, positive ETF reports, stablecoin supply growth, and Fear & Greed at 71 rather than a panic reading. There is no verified daily loss of $77k, $72k, or the approximately $57.7k low. There is no direct heatmap showing a market-wide vacuum.
That does not make the move healthy. It means the evidence supports first deleveraging, not final capitulation. A correction can become a cascade later. Today is the point where that distinction becomes observable.
7. The confirmation road
| Node | What it means | What confirms it | What invalidates the path |
|---|---|---|---|
| $85–86k | Immediate acceptance test after the rejection | Daily closes above $86k with flow persistence | Repeated failure and close below $82k |
| $82–83k | First support area after the squeeze | Hold on daily closes while OI resets | Close below $82k, then no 48-hour reclaim |
| $80k | Round-number repair / failure line | Reclaim after a sweep with spot participation | Acceptance below it opens the old correction map |
| $77k | Inherited correction gate | Holds with ETF and spot repair | Two daily closes below it |
| $74–76k | Process band from Issues 23–24 | Orderly test and reclaim | Fast loss with rising liquidation intensity |
| $71–72k | Next structural decision near the 50-day | Hold and recover | Daily acceptance below it |
| ~$57.7k | 2026 low / cycle-bottom gate | Sweep-and-reclaim strengthens bottom case | Break and failed reclaim with forced selling |
| ~$38k | Severe-tail reference only | Every prior door fails with depth and collateral stress | Any durable recovery above the failed door |
8. The clock
Late September can contain early deleveraging. October can contain lower highs and support tests. A late-October to early-November structural failure is a conditional possibility. Mid-November is a hypothesis window only if the sequence confirms. It is not an appointment, a calendar trade, or a reason to move the levels when the market refuses to cooperate.
The clock is a way to avoid confusing sequence with duration. The desk will not use it to manufacture a catalyst or to reinterpret a normal recovery as a missed crash.
9. The case that $58k was the bottom
The bull case has real evidence. Price is above the 20-, 50-, and 200-day averages. MACD remains positive. ETF flows turned from two large outflow days to several large reported inflow days. Stablecoin supply is modestly higher month over month. A long flush that is absorbed near $84k can be a reset, not a prelude to collapse. If price holds $82–83k and ETF creations persist after leverage comes out, the $57.7k low deserves more respect as a completed bear low.
That is not the same as calling a new target. The bull case must still prove demand after the forced buying is gone.
10. The case that the final tail remains ahead
The bear case has a different strength: it does not need a new headline. It needs sequential failure. The rally may have rebuilt confidence and OI faster than cash demand could absorb it. The 23 September flush shows that long leverage is now present. A close below $82k, then $80k and $77k, with ETF outflows and weak spot participation would reopen Issues 23–24's process road. A later failure through $71–72k and the approximately $57.7k low would be the first evidence that the low was not final.
Only after those doors fail does a severe-tail reference near $38k become analytically useful. Before then, naming it is false precision.
11. Global M2
The latest releases point in one direction but not one timing. US M2 was $23.34T in August, up from $22.09T a year earlier. China's August M2 growth was reported at 7.5% year over year. Euro-area M3 grew 3.4% in July. Japan's August M2 grew 2.0%. US H.6 · ECB · BOJ
Inference: expanding broad money can make a long post-crash depression less likely. It does not equal market liquidity, available collateral, credit creation, or risk appetite at the exact moment a leveraged position is liquidated. There is no fixed M2-to-Bitcoin lag in this packet. Rising M2 is a counterargument to permanent darkness, not an invalidation of a fast drawdown.
12. Machine speed
Hypothesis: AI assistants, trading algorithms, and autonomous agents may compress the time between information, execution, market-maker adjustment, and liquidation. That can amplify displacement. The opposite is also plausible: arbitrage, market making, verification, and risk controls can absorb a dislocation faster. The correct hypothesis is two-sided: automation may increase both displacement speed and recovery speed.
No evidence in this freeze isolates automation as the cause of 23 September's move. The observable mechanism is leverage. Machine speed is a research question, not a causal claim.
13. Wild card: UNKNOWN
There is no verified wild card in this packet. Do not fill the slot with a scary headline. A wild card matters only if it changes liquidity, collateral, funding, confidence, or forced positioning. Until then, the working equation is a reminder, not a model:
Tail severity ≈ shock × fragility × leverage × synchronization × reaction speed.
14. What would prove the Controller wrong
Two daily closes above $86k, followed by a durable reclaim of $87.4k with persistent ETF creations, stable OI, positive spot participation, and no sequential loss of $82k/$80k would falsify the immediate Controller road. A new high by itself is not enough; demand quality is part of the test.
15. What would strengthen the Controller
A daily close below $82k, then $80k and $77k, with continued ETF deterioration, rising or disorderly liquidation intensity, weakening spot participation, and cross-market stress would strengthen it. Failure at $71–72k and then below the approximately $57.7k low would move the final-tail case from hypothesis toward evidence. The date still would not become an appointment.
16. What we still don't know
- Whether the 23 September ETF row is a complete daily total and whether creations persist after the squeeze.
- Whether the OI decline is a healthy reset or the first phase of a broader deleveraging cascade across venues.
- Whether spot CVD, miner flows, exchange flows, and long-term-holder behavior confirm cash demand.
- Whether options skew and dealer positioning are adding downside convexity.
- Whether the $57.7k low is a completed bottom or only the first capitulation.
- What, if anything, would constitute the wild card.
17. One card
We are early.
The approximately $87.4k print may prove to be a sweep, or it may simply be another step in a new bull market. September's liquidation demonstrated the mechanism. It did not establish the tail.
The road still runs through approximately $82–83k, $80k, $77k, $74–76k, and $68–72k before the severe-tail hypothesis earns the right to discuss approximately $38k. Mid-November is a hypothesis window, not an appointment.
The strongest competing hypothesis remains simple: approximately $58k was already the bottom. Twenty-three analytical lenses argued both sides. The market gets the final vote.
Decision: WAIT.
Sources
- Coinbase BTC-USD ticker and daily candles — spot and completed UTC structure.
- CoinGecko Bitcoin market data and global market data — ATH, market cap, volume, dominance.
- Farside Investors — US spot Bitcoin ETF flows, with 23 September marked preliminary.
- OKX open interest, funding, and spot ticker — venue-specific derivatives and premium snapshot.
- Deribit options — implied volatility and book observations; dealer gamma not inferred.
- Alternative.me Fear & Greed, DefiLlama stablecoins, and S&P Global PMI.
- Federal Reserve H.6, ECB monetary developments, BOJ money stock, and China M2 report.
- Cointelegraph and PrimeXBT — secondary liquidation reports; windows differ and are used directionally.
Educational-not-financial-advice disclaimer. This letter is educational scenario research, not personalized financial advice. It does not recommend buying, selling, leverage, or any position size. Levels are observation points, not instructions. Cash is a valid position when confirmation is absent. Named traders and firms are analytical lenses only. Observable evidence overrides every model, including the Controller.
Educational scenario research. Not personalized financial advice. No execution, no position sizing, no leverage recommendation. Older issues remain in the archive and are not removed when a new letter is posted. Read who the agents are.